In a detailed and insightful post shared on X, renowned crypto analyst Egrag Crypto laid out his analysis of XRP’s potential price movement. Utilizing Fibonacci (Fib) Channel charts across multiple time frames, Egrag outlines a meticulously crafted path that suggests XRP may be on the brink of a major rally—one that could ultimately lead to a staggering price of $27.
This comprehensive breakdown dives deep into five critical timeframes, providing traders and investors with a clear roadmap for understanding XRP’s current position and potential trajectory.
Monthly Time Frame Analysis: The Foundation of a Macro Bullish Trend
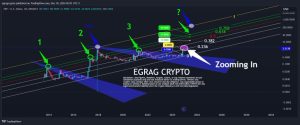
The monthly chart serves as the cornerstone of Egrag Crypto’s analysis. By leveraging the Fib Channel, the analyst highlights key support and resistance levels that reveal the broader trend for XRP.
According to Egrag, XRP’s breach of the $0.75 zone marked a significant milestone, as this level was identified as a crucial price expansion target. Now, XRP has broken into the Fib Channel’s 0.236 level—a powerful bullish signal that indicates the potential for a sustained rally.

Egrag emphasized the importance of XRP closing the monthly candle above the 0.236 Fib level. Achieving this would solidify the bullish momentum, potentially unlocking a path toward the 0.382 Fib level. This breakthrough would be a green light for a major upward move, laying the groundwork for XRP’s long-term rally to higher price levels.
Weekly Time Frame Analysis: Key Price Levels in Play
The weekly chart offers a closer look at XRP’s intermediate-term movements, focusing on pivotal price levels and potential scenarios. According to Egrag, If XRP closes below $2.44 on the weekly chart, the likelihood of a retracement to $2.05 increases significantly. This would represent a temporary pullback, giving XRP an opportunity to consolidate before making another push higher.
On the other hand, a weekly close above $2.60 would signal a breakout from macro resistance levels. Such a move would open the door for a potential rally toward XRP’s all-time high (ATH), creating a highly bullish environment for the token.
The weekly time frame acts as a critical battleground, with these levels serving as clear indicators of XRP’s next move.
3-Day Time Frame Analysis: A Christmas Breakout Incoming?
Zooming in further, the 3-day chart reveals a bullish ascending triangle pattern, a formation known for its tendency to break to the upside.
The ascending triangle indicates strong support at lower levels, with buyers consistently stepping in. Meanwhile, resistance at higher levels is gradually weakening, suggesting an impending breakout. The apex of this pattern is expected to form between December 25th and 28th, making the holiday season a potentially pivotal period for XRP.
Should the triangle break upward as expected, XRP could reach $3.288. This aligns with broader bullish momentum observed in higher time frames, potentially setting the stage for further gains.
1-Day Time Frame Analysis: A Crucial Turning Point
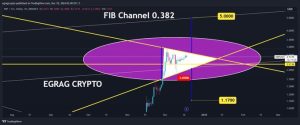
The daily chart presents a mixed picture, reflecting both bullish and bearish possibilities. Currently, XRP is trading within a symmetrical triangle, a neutral pattern that could break either upward or downward. The direction of the breakout will likely determine XRP’s short-term trajectory.
If XRP breaks upward, the measured move target is $5, aligning with the Fib Channel’s 0.382 level. This would reinforce the bullish narrative and attract more momentum-driven buyers. Conversely, a downward breakout could see XRP retesting the macro support level at $1.17. While this would represent a significant pullback, it could also provide an attractive entry point for long-term investors.

This time frame underscores the importance of monitoring the broader market environment and XRP’s reaction to key support and resistance levels.
8-Hour and 2-Hour Time Frames: Intraday Battle Zones
Shorter time frames provide a granular view of XRP’s immediate price action, highlighting critical levels for traders to watch; XRP needs to close above $2.70 to confirm an uptrend. This level represents macro resistance, and a breakout above it would signal significant strength, potentially attracting a surge of bullish activity.
Key Support Levels include diagonal support at$2.33, horizontal support at $2.24 and macro support at $2.00. These levels are crucial for maintaining bullish momentum. A failure to hold these supports could lead to a deeper retracement, while successful defense would reinforce XRP’s upward trajectory.
The Long-Term Vision: Can XRP Reach $27?
While Egrag Crypto’s analysis primarily focuses on the near- and medium-term outlook, the underlying implication is clear: XRP’s bullish trajectory could eventually lead to a price as high as $27.
Achieving this ambitious target would require a combination of macro-level support, favorable market conditions, and sustained bullish momentum. Each time frame builds upon the other, creating a cohesive narrative that points to XRP’s potential for exponential growth.
As at report time, XRP trades at $2.46, exhibiting 1.78% appreciation in the last 7 days
Disclaimer: This content is meant to inform and should not be considered financial advice. The views expressed in this article may include the author’s personal opinions and do not represent Dailyadaa’s opinion. Readers are urged to do in-depth research before making any investment decisions. Any action taken by the reader is strictly at their own risk. Dailyadaa is not responsible for any financial losses.
